Annual reports are usually read one at a time. That is natural enough, but it can miss something important.
In many cases, the more revealing exercise is to compare one year’s report with the previous year’s and focus on what changed. This is not just the financial results, but the wording, the emphasis, the KPIs, the risk discussion and the way management chooses to present the business.
That matters because an annual report is not just a compliance document. It is also one of the clearest records of how a company explains itself to shareholders, lenders and the wider market. When that explanation changes, the reasons can be important.
Sometimes the change reflects a real shift in trading, strategy or financial position. Sometimes it reflects a better articulation of the same underlying story. Sometimes it raises questions about consistency, credibility or disclosure discipline.
That is why I think year on year comparison is useful.
For companies, it is a good internal discipline. Could the business explain each material change in wording, emphasis or disclosure from one year to the next, and explain why it changed?
For readers, whether investors, analysts, lenders, advisers or board members, it is a practical way to get more quickly to the areas that matter most.
When I worked as an equity analyst, I would have found a tool like this particularly useful. It would not have replaced proper reading and judgement, but it would have helped me identify more quickly what management had changed, what had become more prominent and what had quietly moved into the background.
What this prompt is designed to do
The prompt I have used here is not intended to create a simple redline or a long list of minor drafting differences.
Its purpose is to compare two annual reports from the same company and identify the most meaningful changes across areas such as:
- financial performance and position
- KPI movements
- tone and management narrative
- governance and risk disclosure
- presentation choices that may affect how performance is understood
It is designed to separate three things clearly:
- factual change
- change in wording or presentation
- the likely implication of that change
That distinction matters. A company may report genuine improvement, but frame it selectively. Equally, wording may change without there being any real underlying deterioration. A useful comparison needs to tell the difference.
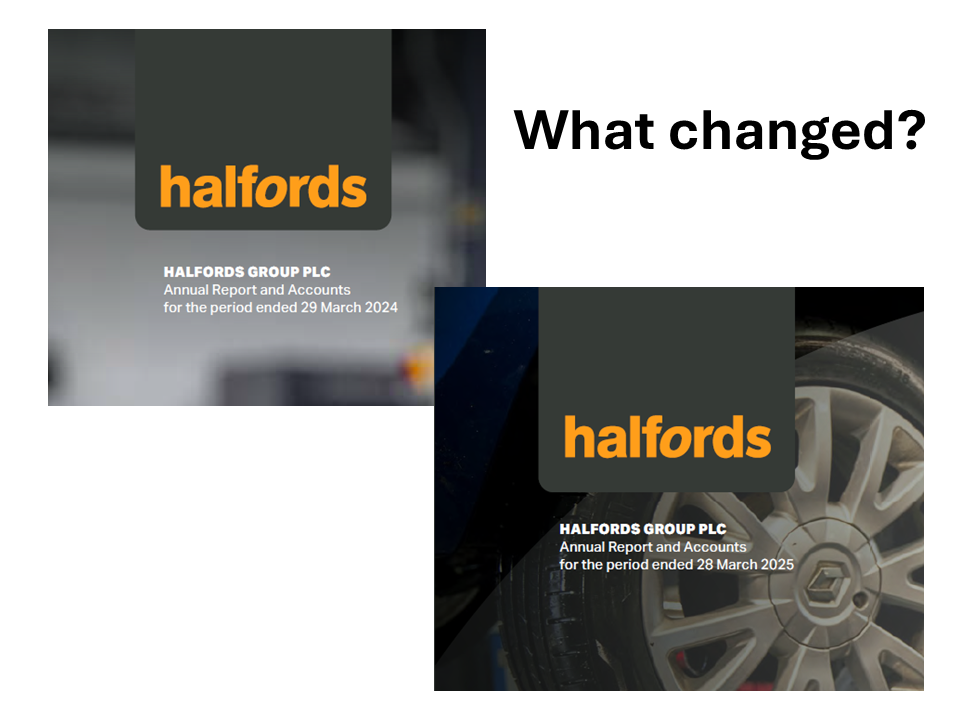
The example used here: Halfords
To show how this works in practice, I ran the prompt on the last two annual reports published by Halfords. One of them was 198 pages long and the other was 230 pages long.
The source reports came from the Halfords investor relations website:
This makes a helpful example because the business is managing a mix of retail, autocentres, services and loyalty activity, while also presenting a narrative around margins, cash generation and strategic execution. That creates plenty to compare from one year to the next.
What the Halfords comparison brought out
The full output is detailed, but the main points that stood out to me were these.
1. Underlying progress improved, but statutory profit deteriorated sharply
The comparison shows that comparable underlying profit improved on management’s preferred basis, but reported profit moved from a profit to a loss because FY25 included substantial non-underlying charges, mainly impairment. That creates a more mixed picture than a quick reading might suggest.
2. Gross margin improved clearly, but cost pressure absorbed much of the benefit
The analysis shows a meaningful improvement in gross margin, helped by pricing, buying and FX, but also points out that labour inflation and reinstated incentives meant not all of that gain flowed through to operating profit.
3. Cash generation and balance sheet strength improved
One of the clearest positives in the comparison is stronger free cash flow and a stronger net cash or net debt position, depending on the lease basis used. This supports the resilience narrative more convincingly than the profit line alone.
4. Fusion moved from pilot to core operating model
In the earlier report, Fusion was still presented as a successful trial. In the later report, it becomes much more central to the business model and future returns case. That is a meaningful strategic shift in emphasis.
5. Motoring Club became much more commercially important
The output highlights stronger membership growth and a deeper role for the club in driving garage activity and subscription revenue. This makes the data and loyalty proposition more economically tangible than in the prior year.
6. The tone became more confident about self-help
The later report places more weight on execution, controllable levers, asset optimisation and resilience, rather than simply waiting for consumer conditions to recover. That is an important narrative shift.
7. Health and safety became more prominent
The later report added a new principal risk around health and safety and disclosed two colleague fatalities. That is a major change in seriousness and disclosure emphasis.
8. Comparability remained awkward
One of the most useful parts of the analysis was the handling of the discontinued-operations issue. The comparison notes that management steers readers towards a more favourable year on year basis, which may be fair, but still makes the reports harder to compare cleanly.
Why I think this matters
What I like about this sort of exercise is that it sits in the right place between efficiency and judgement.
It can save time by surfacing the main changes quickly. More importantly, it helps the reader ask better questions.
For example:
- Has the company changed the way it describes its strategy?
- Are risks getting more attention, or less?
- Have some KPIs become more prominent while others receive less emphasis?
- Is the company more confident, more cautious or simply more selective in what it is highlighting?
- Are there presentation choices that make performance look stronger than it appears on a stricter basis?
Those are useful questions for investors and analysts, but they are just as relevant inside the company.
From an Investor Relations perspective, this matters because part of the role is not just helping to produce the annual report. It is understanding how the company’s narrative is evolving over time and making sure those changes are coherent, supportable and properly understood before the market starts asking questions of its own.
The prompt used
The full prompt is available here:
Full prompt used for comparing the reports
The prompt itself is deliberately structured. It asks the model to focus on material differences, quantify changes where possible and distinguish between factual developments, presentational changes and likely implications. It also asks for a clear output structure, covering executive summary, financial changes, KPI movements, management tone, governance differences, follow-up questions and an overall assessment.
The full Halfords output
The full analysis output is available here:
Full Halfords annual report comparison
The full output includes:
- an executive summary
- financial comparison
- KPI analysis
- tone and narrative assessment
- governance and disclosure differences
- red flags and suggested follow-up questions
- an overall assessment
- a short appendix of potentially overlooked changes
A final point
AI does not remove the need for judgement. It does not replace careful reading and it does not know, by itself, why management made a particular disclosure choice.
What it can do is structure the comparison, highlight the areas of change and bring the more interesting points to the surface faster.
Used that way, it is not a gimmick and it is not a substitute for analysis. It is a practical reading and challenge tool.