Annual report timetables are not just company-specific, they are process-specific
I analysed a cleansed set of FTSE 350 annual report filings from 2020 to 2025 to understand what drives reporting speed. Some delays are structural (calendar congestion, audit capacity) but a meaningful share is avoidable, and avoidable delay is usually a process problem.
Ask me to review your timetable
Quick summary for skim readers
What this analysis shows
- Filing lag varies by period end month, so the calendar does matter
- Sample size is concentrated in a few month ends, especially December, so context matters
- The fastest filers tend to be businesses with disciplined, repeatable reporting machines, not magical shortcuts
- Covid-era disruption heavily affects the slowest tail in 2020 and 2021, so I treat outliers carefully
What this page is for
This page expands my LinkedIn post on this subject. It explains the charts and sets out the practical, avoidable causes of delay, plus what a more robust timetable looks like.
Definitions and method
What I mean by filing lag
Filing lag = number of days between the financial period end and the annual report filing or publication date in my dataset.
What is in the dataset
- FTSE 350 annual report filings
- Periods ending 2020 to 2025
- Cleansed to remove obvious duplicates and noisy variants where possible (for example multiple formats or corrected postings)
What this is and is not
This is benchmarking, not a judgement on quality. There are good reasons for delay in some cases, but recurring slippage usually signals process friction somewhere in the chain.
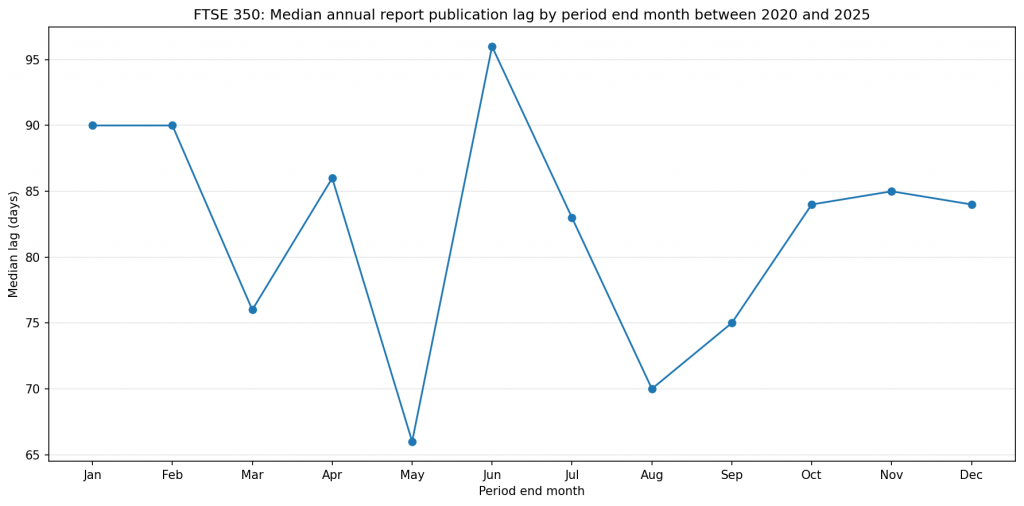
Chart 1, median filing lag by period end month
What you are looking at
This chart shows the median lag for companies grouped by the month in which their year end falls.
The point
If you benchmark your timetable against a generic “market average” you can mislead yourself. A December year end company is operating in a different reporting environment than, say, an August year end company.
What tends to drive the month effect
- Audit workload peaks
- Board and committee calendars
- Staff holidays, especially around year-end reporting seasons
- Investor and stakeholder expectations for results cadence
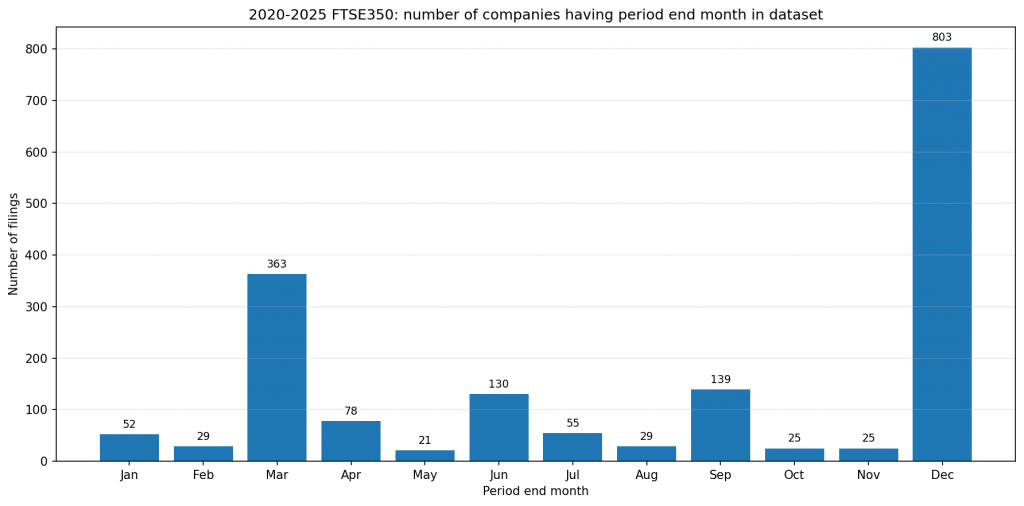
Chart 2, filing counts by period end month
Why this matters
This is the context chart. Some months have far more filers than others, so their behaviour dominates the aggregate picture. December is the clearest example.
How to use it
When comparing month-end medians, keep an eye on sample size. A month with a small count can swing more easily due to a few unusual situations.
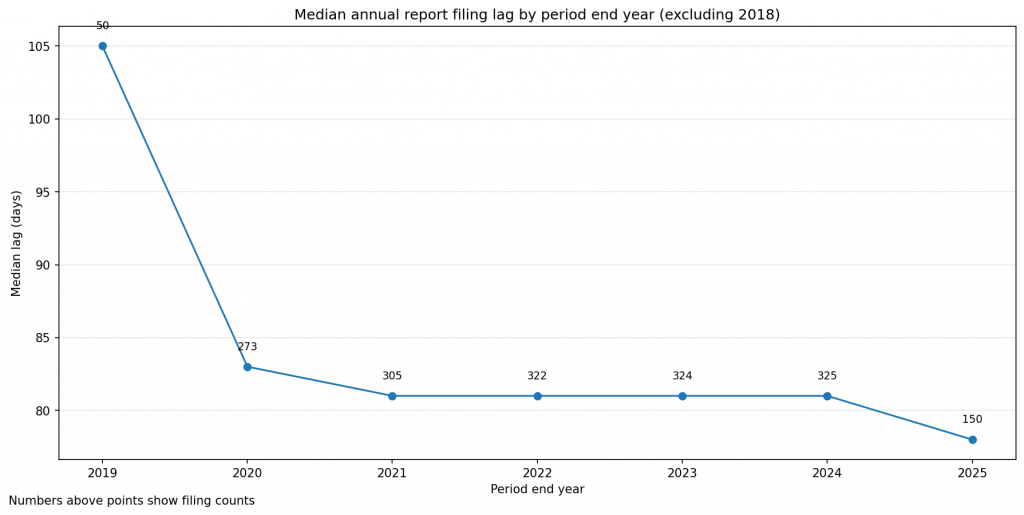
Chart 3, median filing lag by period end year
Why include this
This is a sanity check across time. It helps answer: are timetables improving, flat or getting worse.
How to interpret it
If the median is broadly stable, it suggests the main differentiator is less “the year we live in” and more “how the process is run”. If it shifts materially, you then ask what changed, regulation, audit market, reporting burden, governance.
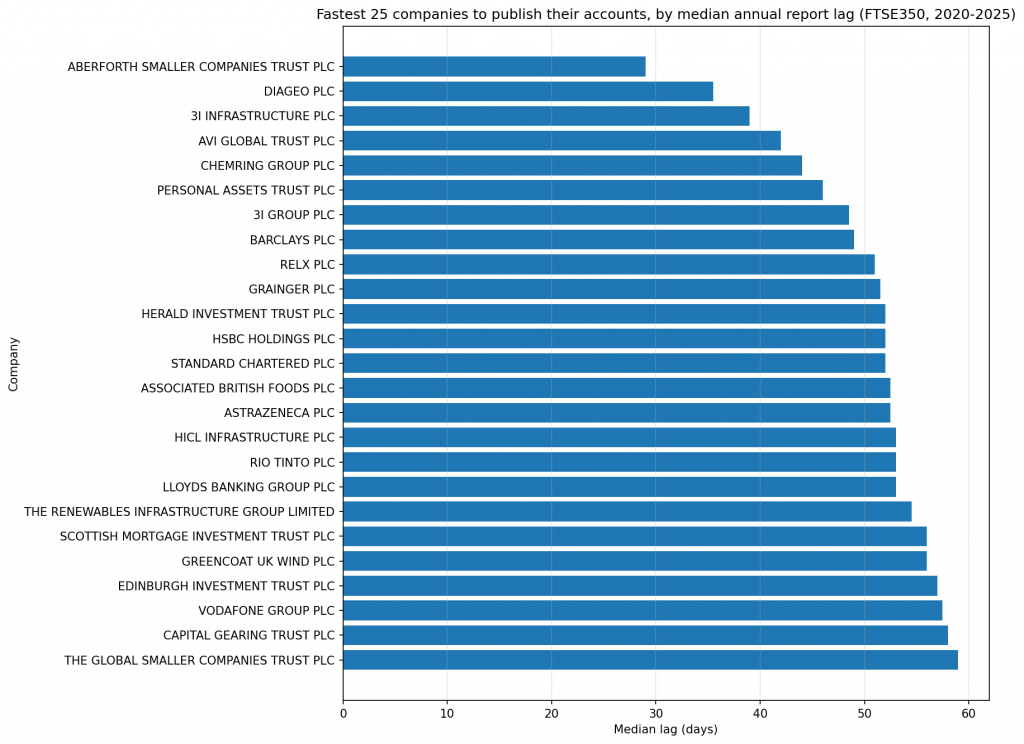
Chart 4, fastest cohorts by median lag
What this chart adds
This chart makes the discussion practical. It shows that strong outcomes are achievable in the market, and that speed is often correlated with repeatability and control.
My interpretation
The fastest cohorts are frequently sectors with:
- Highly standardised reporting packs
- Mature close processes
- Tight document production workflows
- Strong governance rhythm (committees booked early, sign-offs staged, fewer last-minute rewrites)
Chart 5, slowest cohorts, handled carefully
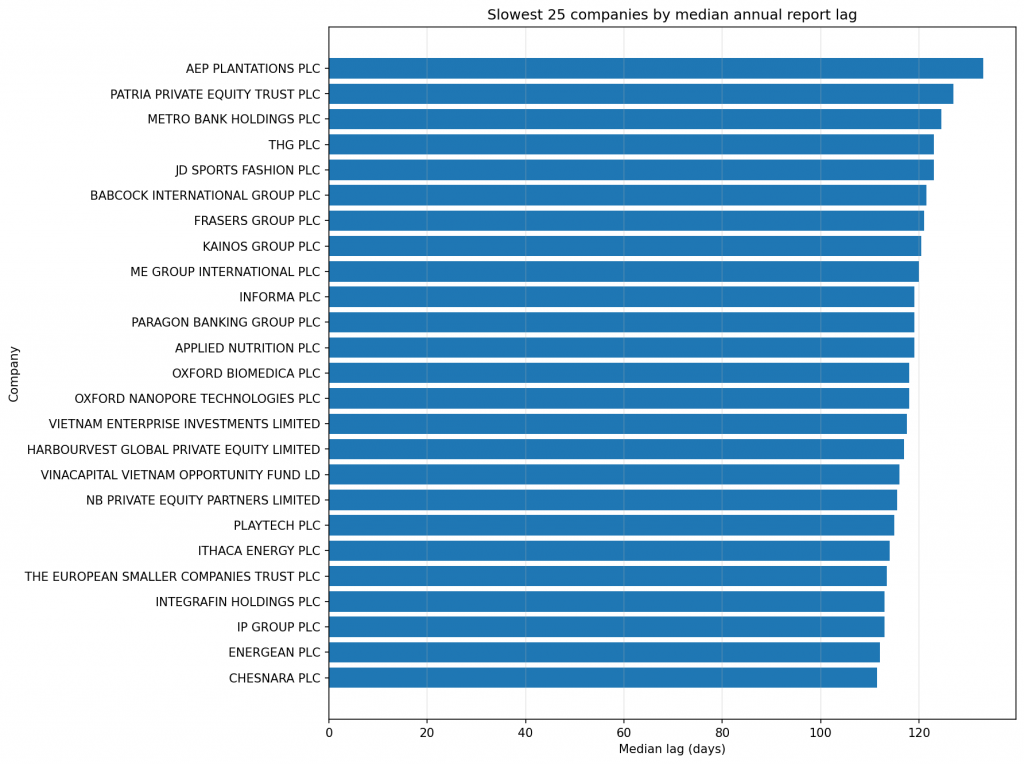
A note on “slowest”
I am not using this to name and shame. In 2020 and 2021 in particular, Covid-era disruption materially influenced the slow tail for some issuers. There are also legitimate reasons for delay, major transactions, auditor change, governance resets, complex impairments.
Why include it on this website
It is still useful as a diagnostic prompt. When delays are repeated across multiple years, or when a company is consistently late relative to its peer month-end group, the causes are often avoidable.
The avoidable delays, what typically slows teams down
Here are the recurring avoidable causes I see, and what “good” looks like.
1) Close process slippage
Avoidable delays often start here.
- Good looks like: clear close calendar, ownership by workstream, hard cut-offs, fast issue escalation
2) Drafting starts too late
- Good looks like: skeleton report built early, front half narrative drafted alongside the close, standard tables automated
3) Review cycles are unbounded
- Good looks like: defined review rounds, change control, tracked comments, rules for late changes
4) Governance is treated as a single cliff edge
- Good looks like: staged sign-off, early committee read-outs, board time protected
5) Production is left to the end
- Good looks like: parallel production, early page plan, stable templates, clear responsibility split between finance, IR, company secretariat and designers
6) Auditor bottlenecks are not managed proactively
- Good looks like: early audit planning, agreed materiality and key judgements timetable, fast turnaround on audit queries, no last-minute paper creation
What I can do for you
Reporting timetable review
If your annual report timetable feels tighter every year, I can review your current process and suggest practical efficiencies across close, drafting, review, sign-off and publication.
What you get:
- A short diagnostic call
- A timetable critique with high-friction points highlighted
- A practical set of changes that reduce slippage risk
- Optional benchmarking against peer month-end patterns
If you want a fresh pair of eyes, send me your current timetable and I will tell you where the avoidable delay is hiding.
FAQ section
Does filing faster reduce quality
Not automatically. The goal is fewer last-minute changes, cleaner governance and fewer avoidable iterations. Done well, that improves quality.
Should we change our year end
Usually no. Fix the process first.
What about ESEF
ESEF (European Single Electronic Format) can add production and validation steps. The key is to bring tagging, validation and conversion into the plan early, not at the end.